“Most Finnish thrash fans preferred vinyl” says far more than “most respondents to an online collector poll preferred vinyl.” One claim speaks for a scene; the other describes the people who answered. Before citing either, find the original question, check who responded and see whether the percentage includes everyone surveyed or only those who answered that question.
A small survey can tell us something useful about a music community, especially one whose listeners and collectors are rarely studied. The trouble starts when answers from dedicated collectors become a claim about every listener, musician or person at a gig. The checks that follow help keep the finding within its limits.
Find the survey behind the number
Go to the original report, questionnaire or data release rather than a headline repeating the result. A news story may leave out the field dates, the question's wording or a qualification that changes its meaning. If you can find only a secondhand account, cite it as such; don't imply you've inspected the survey.
Note who conducted the research, who commissioned it, when responses were collected and where the methods are documented. A commission doesn't make a finding false, but it may help explain why certain questions were asked or highlighted. A report on recorded-music buying, for example, might cover physical purchases without asking about streaming or attendance at small shows.
Is the figure drawn from one survey, an annual series or a compilation of separate studies? Projects can define “music fans” differently even when they use the same label. If you can't find the original question or a description of respondents, take that gap into account before citing the number.
Identify the population and the respondents
Who was the survey meant to describe?
The target population is the group a survey aims to describe: adults in Finland, perhaps, or ticket buyers at one festival. The sample is the people whose answers were collected. Don't quietly substitute one for the other.
Suppose an archive invites its readers to answer a poll about independent thrash releases. The results describe the participating readers, who may include plenty of committed collectors; they don't establish what Finnish metal listeners generally prefer. A festival poll reaches people who were at that event and encountered the poll. Even a national survey may have too few answers from listeners of a niche genre to support a genre-specific claim.
Look at recruitment, too. Were people selected through a probability-based process, invited from a standing panel, approached at a venue or free to answer a social-media post? That choice affects how far you can extend the results beyond respondents. An opt-in poll doesn't become representative just because thousands of people answer it.
Who could not take part?
Language, location, age limits and access requirements all affect who a survey can reach. An English-language online form about a Finnish scene might miss Finnish-speaking listeners who never see it. A questionnaire distributed through record shops may miss people who buy only digital releases. These are possible coverage gaps, not proof that the recorded answers are wrong. They do, however, narrow what those answers can support.
Read the question, not just the percentage
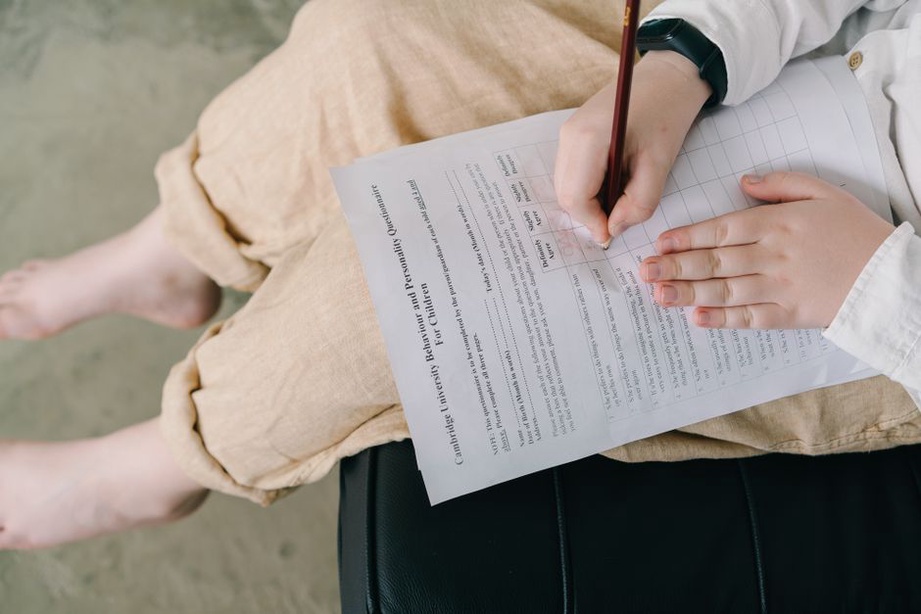
“Which formats have you bought in the past year?” lets someone select both vinyl and CDs. “Which format do you prefer?” asks for a preference. “Which format did you buy most often?” asks about frequency. None of those questions necessarily measures “vinyl's share of music purchases.”
Read the answer options and the instructions. Could respondents choose more than one? Was “none” an option? Did the published figure leave out “not sure”? Look at any introduction that framed the question and at questions immediately before it. Those details are particularly important when a result looks unusually precise or surprising.
Check the timeframe as well. Buying a release “in the last 12 months” differs from ever having bought one. If the report gives a result a shorthand label, use the underlying question to guide your own wording.
Check the denominator before writing the sentence
Every percentage has a base: the people or answers used to calculate it. A report might find that 60% selected vinyl among respondents who bought physical recordings, not among everyone surveyed. Another table may exclude people who skipped the question. Change the base in your sentence and you've changed the finding.
Find the number behind the specific result, not just the survey's headline sample size. If a survey of 1,000 people has 80 self-identified metal listeners who answered a format question, the base for that subgroup result is 80. “Of the metal listeners who answered this question” takes more words than “of metal fans,” but it tells readers whose answers they're seeing.
Watch for weighted percentages. Researchers may adjust responses to reflect known characteristics of a population, so a weighted percentage can differ from the raw count divided by the unweighted respondent total. Don't multiply a weighted percentage by the unweighted sample size to reconstruct a count. When both weighted and unweighted bases appear, keep them distinct.
Multiple answers and rounded totals
If people could select several answers, the percentages may add up to more than 100%: each one can represent the share who chose that option. Single-choice percentages may total 99% or 101% because of rounding. Check the questionnaire and table notes before calling either an error.
Judge precision without inventing certainty
A 51%–49% split doesn't automatically show which view is more common in the wider population. In a probability sample, confidence intervals can help show how much sampling variation might affect a result. Subgroup estimates are usually less certain than estimates based on the full sample. If the report supplies intervals, use the one for the figure you're citing rather than an overall margin of error.
A conventional margin of error doesn't account for every problem, including nonresponse, question wording and coverage. Nor can you simply apply one to an opt-in poll as if its respondents had been randomly sampled. Without a sound basis for a population estimate, write about the survey's respondents, not the population they might appear to represent.
Decimal places can suggest more certainty than the evidence warrants. “About half of respondents” may serve readers better than “49.7% of fans” when the sample is small, the base is unclear or the figure comes from rounded weighted data. Keep the published number in your notes even if you round it in the article.
Be careful with comparisons and trends
Two figures make a credible trend only if the populations, recruitment methods, questions and answer choices are sufficiently alike. Switching from a phone survey to an online opt-in poll could change the result without any change in people's behavior. Adding “streaming” to a newer questionnaire might draw answers away from categories used in the older one.
Check field dates before tying a survey to a period in scene history. A poll conducted after a festival can't establish what attendees thought beforehand. A survey of current preferences isn't direct evidence of what listeners preferred in the late 2000s, either. Present-day answers about the past can add context to an archive, but they aren't responses collected at the time.
Place matters as much as time. A survey of European concertgoers isn't a measure of Finland just because some respondents were Finnish. Find a reported Finland-specific subgroup, and check its base, before making a national comparison.
Make the claim no broader than the evidence
A survey records what people say, which isn't always what they do. Someone may prefer small venues but attend large festivals more often because of where they live, their schedule or what's available. An association isn't proof of cause, either: if record collectors report attending more concerts, the survey doesn't show that collecting records made them go.
For music-archive work, pair surveys with records that answer different questions. Release credits can establish who played on a recording; dated promotional material can show how an event was advertised. A survey tells you what its respondents recall or prefer. Keep those roles separate, especially when considering the [Finnish thrash scene's limits of mainstream media coverage](/finnish-thrash-metal-mainstream-media/): a broad audience poll cannot document an underreported local event.
Let attribution carry the boundary. “In a poll of the archive's newsletter subscribers, 62% of those who answered the format question selected vinyl” differs from “62% of Finnish thrash fans prefer vinyl.” The first works if the poll records support it. The second needs evidence about the wider population. Words such as “proves” and “everyone” ask the survey to do more than it can.
Keep a usable citation record
Save enough detail to retrace a figure after publication:
- The report title, conducting organization, commissioner and publication date.
- Field dates, target population, recruitment method and total sample size.
- The exact question, response options, subgroup definition and base for the figure.
- Relevant weighting, rounding, uncertainty notes and exclusions.
- The page, table or figure containing the number, alongside the wording you used in your article.
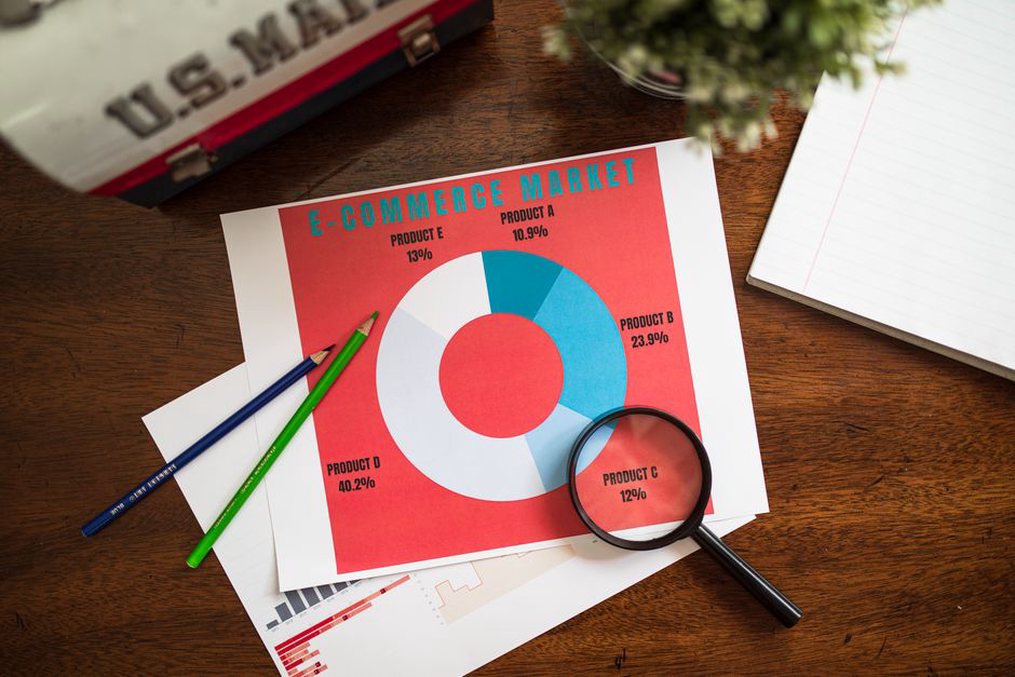
That record helps if a report is revised or a sentence needs correcting: you'll know which version you used. If the only source is a chart with unlabeled bars, don't estimate an exact percentage from their lengths. Use a stated value or describe the pattern without a number.
For the final edit, put the original question next to your draft sentence. Compare the population, timeframe, behavior and denominator in both. If the question asks “Which formats did you buy in the past year?” but the draft says “Finnish fans prefer vinyl,” change “prefer” to “reported buying,” name the surveyed group and check the base for that question. Those edits keep a collector poll from becoming a claim about an entire scene.